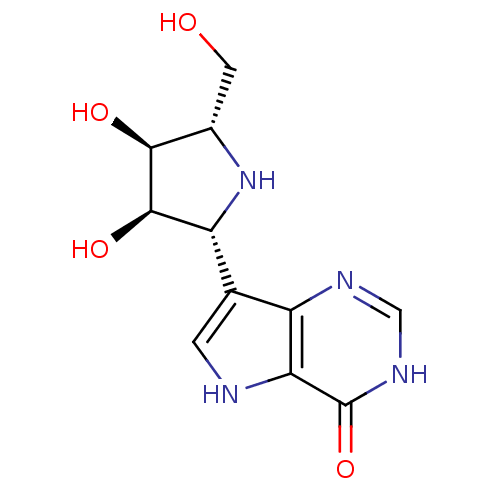
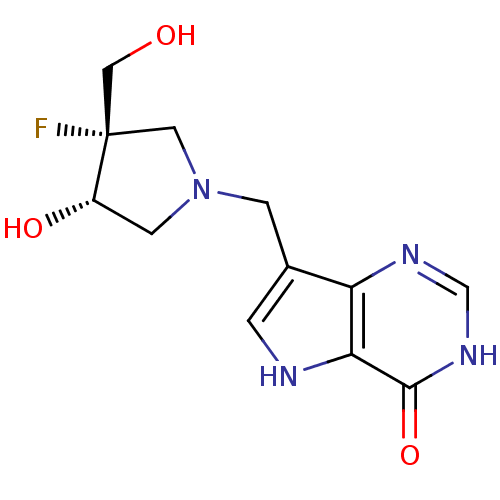
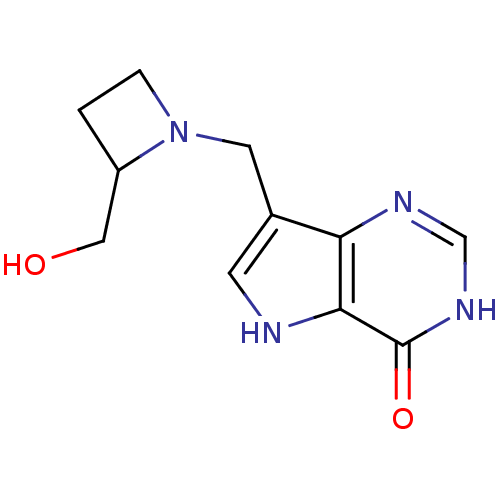
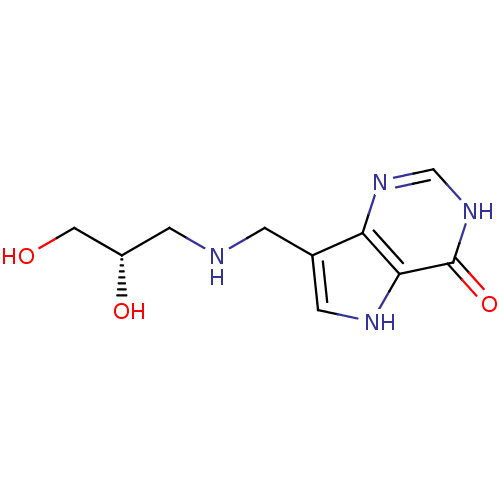
TargetPurine nucleoside phosphorylase(malaria parasite P. falciparum)
Industrial Research
Curated by ChEMBL
Industrial Research
Curated by ChEMBL

Affinity DataKi: 0.5nMAssay Description:Inhibition of Plasmodium falciparum purine nucleoside phosphorylase assessed as slow onset inhibition constant by xanthine-oxidase coupled assayMore data for this Ligand-Target Pair
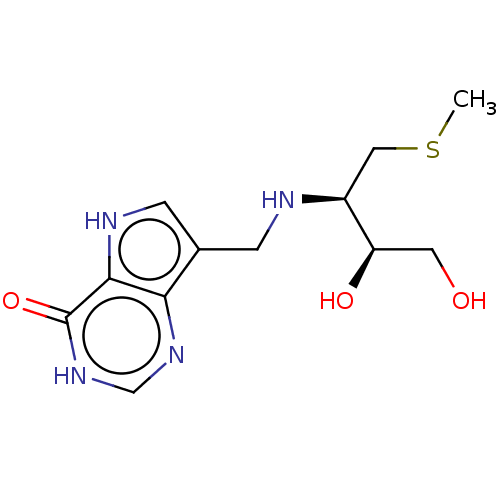
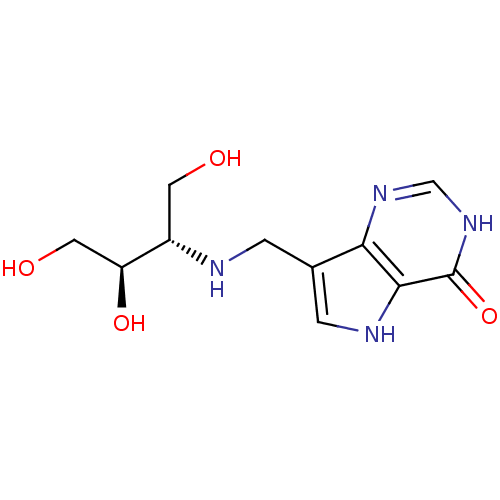
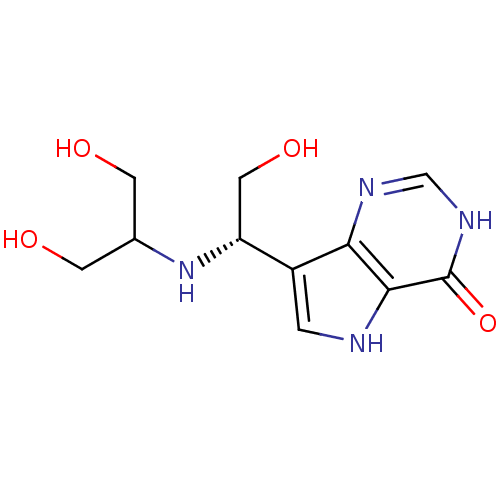
TargetPurine nucleoside phosphorylase(malaria parasite P. falciparum)
Industrial Research
Curated by ChEMBL
Industrial Research
Curated by ChEMBL
Affinity DataKi: 0.5nM ΔG°: -52.6kJ/molepH: 7.7 T: 2°CAssay Description:PNP activity was monitored by absorbance change in a coupled assay. In the assay, inosine was converted to hypoxanthine, and then hypoxanthine was co...More data for this Ligand-Target Pair
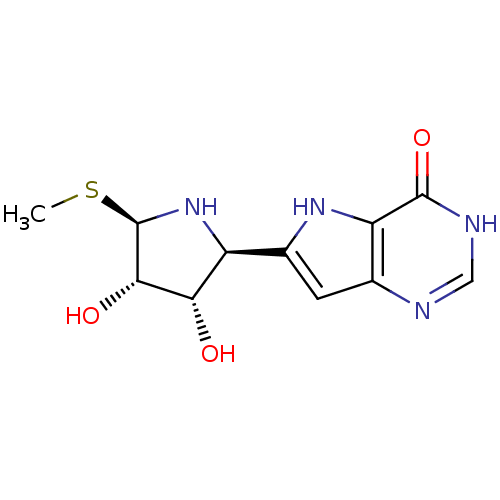
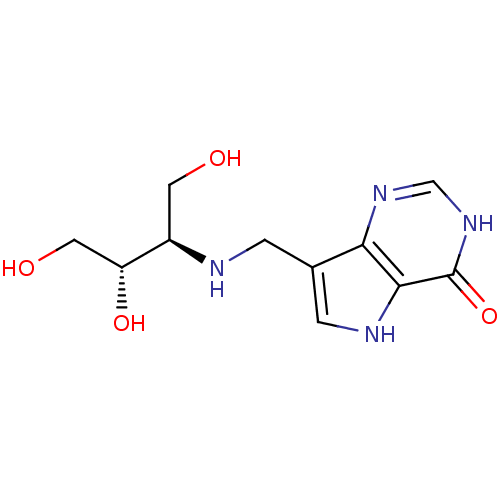
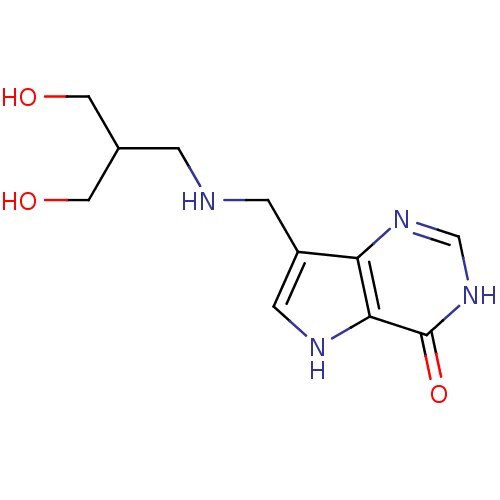
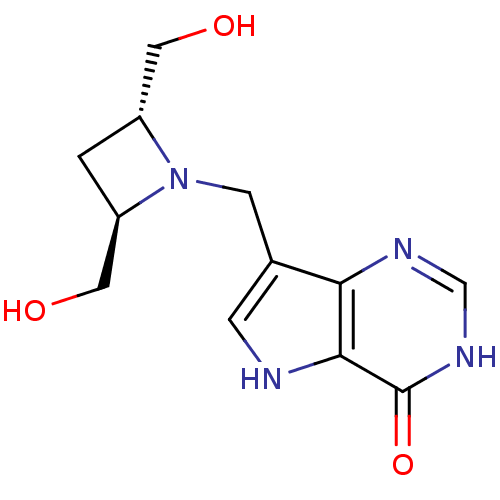
TargetPurine nucleoside phosphorylase(malaria parasite P. falciparum)
Industrial Research
Curated by ChEMBL
Industrial Research
Curated by ChEMBL
Affinity DataKi: 0.5nMAssay Description:Inhibition of Plasmodium falciparum His-tagged PNP expressed in Escherichia coli assessed as inhibitor constant for enzyme-inhibitor complex formatio...More data for this Ligand-Target Pair
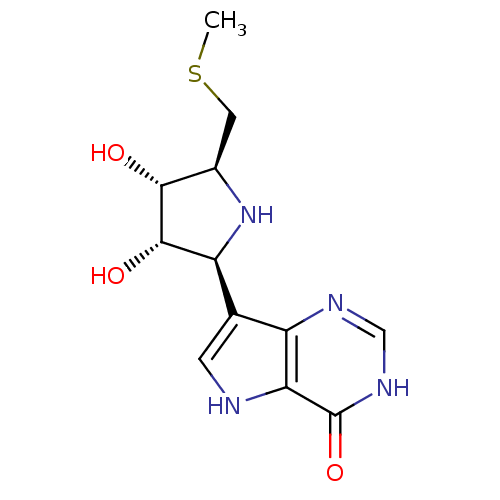
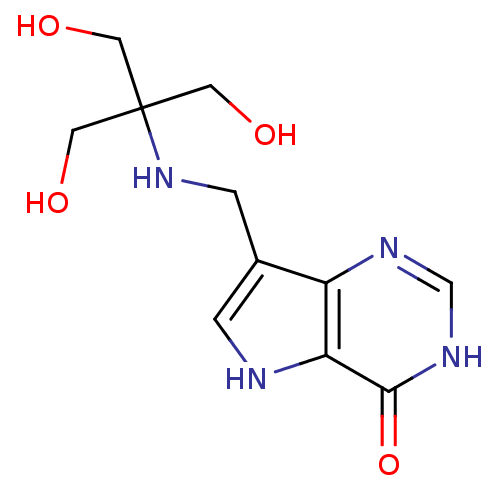
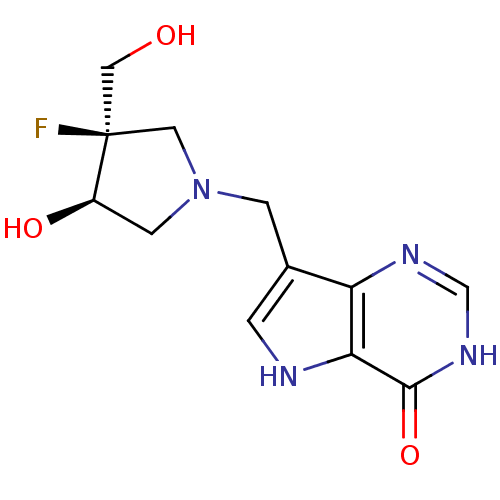
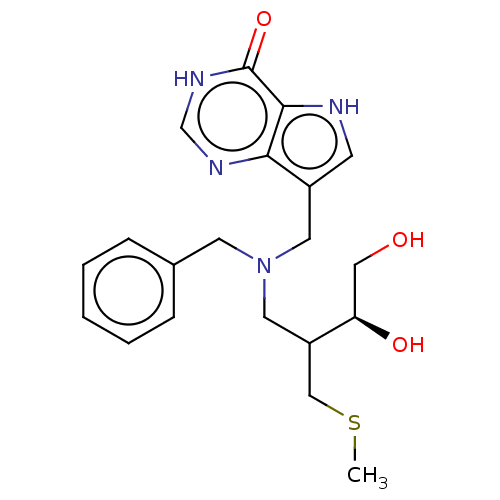
TargetPurine nucleoside phosphorylase(malaria parasite P. falciparum)
Industrial Research
Curated by ChEMBL
Industrial Research
Curated by ChEMBL

Affinity DataKi: 0.600nMAssay Description:Inhibition of Plasmodium falciparum His-tagged PNP assessed as inhibitor constant for enzyme-inhibitor-substrate complex formationMore data for this Ligand-Target Pair
 3D Structure (crystal)
TargetPurine nucleoside phosphorylase(malaria parasite P. falciparum)
Industrial Research
Curated by ChEMBL
Industrial Research
Curated by ChEMBL
Affinity DataKi: 0.680nMAssay Description:Inhibition of Plasmodium falciparum His-tagged PNP assessed as inhibitor constant for enzyme-inhibitor-substrate complex formationMore data for this Ligand-Target Pair
TargetPurine nucleoside phosphorylase(malaria parasite P. falciparum)
Industrial Research
Curated by ChEMBL
Industrial Research
Curated by ChEMBL
Affinity DataKi: 0.860nMAssay Description:Inhibition of Plasmodium falciparum PNP expressed in Escherichia coli BL21(DE3) cells by spectrophotometryMore data for this Ligand-Target Pair
TargetPurine nucleoside phosphorylase(malaria parasite P. falciparum)
Industrial Research
Curated by ChEMBL
Industrial Research
Curated by ChEMBL
Affinity DataKi: 0.890nMAssay Description:Inhibition of Plasmodium falciparum His-tagged PNP expressed in Escherichia coli assessed as inhibitor constant for enzyme-inhibitor complex formatio...More data for this Ligand-Target Pair
TargetPurine nucleoside phosphorylase(malaria parasite P. falciparum)
Industrial Research
Curated by ChEMBL
Industrial Research
Curated by ChEMBL
Affinity DataKi: 0.900nMAssay Description:Inhibition of Plasmodium falciparum His-tagged PNP assessed as inhibitor constant for enzyme-inhibitor-substrate complex formationMore data for this Ligand-Target Pair
TargetPurine nucleoside phosphorylase(malaria parasite P. falciparum)
Industrial Research
Curated by ChEMBL
Industrial Research
Curated by ChEMBL
Affinity DataKi: 0.900nMAssay Description:Inhibition of recombinant Plasmodium falciparum PNP using inosine as substrate assessed as inhibition constant for slow onset inhibition of enzyme-in...More data for this Ligand-Target Pair
TargetPurine nucleoside phosphorylase(malaria parasite P. falciparum)
Industrial Research
Curated by ChEMBL
Industrial Research
Curated by ChEMBL
Affinity DataKi: 0.900nMAssay Description:Inhibition of Plasmodium falciparum His-tagged PNP assessed as inhibitor constant for enzyme-inhibitor-substrate complex formationMore data for this Ligand-Target Pair
TargetPurine nucleoside phosphorylase(malaria parasite P. falciparum)
Industrial Research
Curated by ChEMBL
Industrial Research
Curated by ChEMBL
Affinity DataKi: 1.10nMAssay Description:Inhibition of Plasmodium falciparum PNP expressed in Escherichia coli BL21(DE3) cells by spectrophotometryMore data for this Ligand-Target Pair
TargetPurine nucleoside phosphorylase(malaria parasite P. falciparum)
Industrial Research
Curated by ChEMBL
Industrial Research
Curated by ChEMBL
Affinity DataKi: 1.5nMAssay Description:Inhibition of Plasmodium falciparum His-tagged PNP assessed as inhibitor constant for enzyme-inhibitor complex formationMore data for this Ligand-Target Pair
TargetPurine nucleoside phosphorylase(malaria parasite P. falciparum)
Industrial Research
Curated by ChEMBL
Industrial Research
Curated by ChEMBL
Affinity DataKi: 2.70nMAssay Description:Inhibition of Plasmodium falciparum PNP expressed in Escherichia coli BL21(DE3) cells by spectrophotometryMore data for this Ligand-Target Pair
TargetPurine nucleoside phosphorylase(malaria parasite P. falciparum)
Industrial Research
Curated by ChEMBL
Industrial Research
Curated by ChEMBL
Affinity DataKi: 2.70nMAssay Description:Inhibition of Plasmodium falciparum 3D7 PNP expressed in Escherichia coli assessed as reduction in uric acid formation by spectrophotometric methodMore data for this Ligand-Target Pair
TargetPurine nucleoside phosphorylase(malaria parasite P. falciparum)
Industrial Research
Curated by ChEMBL
Industrial Research
Curated by ChEMBL
Affinity DataKi: 3.60nMAssay Description:Inhibition of Plasmodium falciparum purine nucleoside phosphorylase by xanthine-oxidase coupled assayMore data for this Ligand-Target Pair
TargetPurine nucleoside phosphorylase(malaria parasite P. falciparum)
Industrial Research
Curated by ChEMBL
Industrial Research
Curated by ChEMBL
Affinity DataKi: 11nMAssay Description:Inhibition of recombinant Plasmodium falciparum PNP using inosine as substrate by xanthine oxidase coupling enzyme assayMore data for this Ligand-Target Pair
TargetPurine nucleoside phosphorylase(malaria parasite P. falciparum)
Industrial Research
Curated by ChEMBL
Industrial Research
Curated by ChEMBL
Affinity DataKi: 18nMAssay Description:Inhibition of Plasmodium falciparum His-tagged PNP assessed as inhibitor constant for enzyme-inhibitor complex formationMore data for this Ligand-Target Pair
TargetPurine nucleoside phosphorylase(malaria parasite P. falciparum)
Industrial Research
Curated by ChEMBL
Industrial Research
Curated by ChEMBL
Affinity DataKd: 19nMT: 2°CAssay Description:The inhibitor dissociation constants reported in Table 1 below are for phosphorolysis of inosine by PNP and were based on reaction rates measurements...More data for this Ligand-Target Pair
TargetPurine nucleoside phosphorylase(malaria parasite P. falciparum)
Industrial Research
Curated by ChEMBL
Industrial Research
Curated by ChEMBL
Affinity DataKi: 23.3nMAssay Description:Inhibition of Plasmodium falciparum purine nucleoside phosphorylase assessed as slow onset inhibition constant by xanthine-oxidase coupled assayMore data for this Ligand-Target Pair
TargetPurine nucleoside phosphorylase(malaria parasite P. falciparum)
Industrial Research
Curated by ChEMBL
Industrial Research
Curated by ChEMBL
Affinity DataKi: 29nMAssay Description:Inhibition of Plasmodium falciparum His-tagged PNP assessed as inhibitor constant for enzyme-inhibitor complex formationMore data for this Ligand-Target Pair
TargetPurine nucleoside phosphorylase(malaria parasite P. falciparum)
Industrial Research
Curated by ChEMBL
Industrial Research
Curated by ChEMBL
Affinity DataKd: 55nMAssay Description:Binding affinity to Plasmodium falciparum His6-tagged PNP assessed as reduction in uric acid formation using inosine as substrateMore data for this Ligand-Target Pair
TargetPurine nucleoside phosphorylase(malaria parasite P. falciparum)
Industrial Research
Curated by ChEMBL
Industrial Research
Curated by ChEMBL
Affinity DataKd: 55nMT: 2°CAssay Description:The inhibitor dissociation constants reported in Table 1 below are for phosphorolysis of inosine by PNP and were based on reaction rates measurements...More data for this Ligand-Target Pair
TargetPurine nucleoside phosphorylase(malaria parasite P. falciparum)
Industrial Research
Curated by ChEMBL
Industrial Research
Curated by ChEMBL
Affinity DataKi: 80nMAssay Description:Inhibition of Plasmodium falciparum purine nucleoside phosphorylase by xanthine-oxidase coupled assayMore data for this Ligand-Target Pair
TargetPurine nucleoside phosphorylase(malaria parasite P. falciparum)
Industrial Research
Curated by ChEMBL
Industrial Research
Curated by ChEMBL

Affinity DataKi: 93nMAssay Description:Inhibition of recombinant Plasmodium falciparum PNP using inosine as substrate assessed as inhibition constant for slow onset inhibition of enzyme-in...More data for this Ligand-Target Pair
TargetPurine nucleoside phosphorylase(malaria parasite P. falciparum)
Industrial Research
Curated by ChEMBL
Industrial Research
Curated by ChEMBL
Affinity DataIC50: 103nMAssay Description:Inhibition of recombinant Plasmodium falciparum PNP incubated for 10 minsMore data for this Ligand-Target Pair
TargetPurine nucleoside phosphorylase(malaria parasite P. falciparum)
Industrial Research
Curated by ChEMBL
Industrial Research
Curated by ChEMBL
Affinity DataKd: 163nMT: 2°CAssay Description:The inhibitor dissociation constants reported in Table 1 below are for phosphorolysis of inosine by PNP and were based on reaction rates measurements...More data for this Ligand-Target Pair
TargetPurine nucleoside phosphorylase(malaria parasite P. falciparum)
Industrial Research
Curated by ChEMBL
Industrial Research
Curated by ChEMBL
Affinity DataKi: 191nM ΔG°: -38.0kJ/molepH: 7.7 T: 2°CAssay Description:PNP activity was monitored by absorbance change in a coupled assay. In the assay, inosine was converted to hypoxanthine, and then hypoxanthine was co...More data for this Ligand-Target Pair
TargetPurine nucleoside phosphorylase(malaria parasite P. falciparum)
Industrial Research
Curated by ChEMBL
Industrial Research
Curated by ChEMBL
Affinity DataKd: 210nMT: 2°CAssay Description:The inhibitor dissociation constants reported in Table 1 below are for phosphorolysis of inosine by PNP and were based on reaction rates measurements...More data for this Ligand-Target Pair
TargetPurine nucleoside phosphorylase(malaria parasite P. falciparum)
Industrial Research
Curated by ChEMBL
Industrial Research
Curated by ChEMBL
Affinity DataKi: 260nMAssay Description:Inhibition of Plasmodium falciparum purine nucleoside phosphorylase by xanthine-oxidase coupled assayMore data for this Ligand-Target Pair
TargetPurine nucleoside phosphorylase(malaria parasite P. falciparum)
Industrial Research
Curated by ChEMBL
Industrial Research
Curated by ChEMBL
Affinity DataKd: 260nMT: 2°CAssay Description:The inhibitor dissociation constants reported in Table 1 below are for phosphorolysis of inosine by PNP and were based on reaction rates measurements...More data for this Ligand-Target Pair
TargetPurine nucleoside phosphorylase(malaria parasite P. falciparum)
Industrial Research
Curated by ChEMBL
Industrial Research
Curated by ChEMBL
Affinity DataKd: 297nMAssay Description:Binding affinity to Plasmodium falciparum His6-tagged PNP assessed as reduction in uric acid formation using inosine as substrateMore data for this Ligand-Target Pair
TargetPurine nucleoside phosphorylase(malaria parasite P. falciparum)
Industrial Research
Curated by ChEMBL
Industrial Research
Curated by ChEMBL
Affinity DataKd: 297nMT: 2°CAssay Description:The inhibitor dissociation constants reported in Table 1 below are for phosphorolysis of inosine by PNP and were based on reaction rates measurements...More data for this Ligand-Target Pair
TargetPurine nucleoside phosphorylase(malaria parasite P. falciparum)
Industrial Research
Curated by ChEMBL
Industrial Research
Curated by ChEMBL
Affinity DataKi: 298nMAssay Description:Inhibition of recombinant Plasmodium falciparum PNP using inosine as substrate by xanthine oxidase coupling enzyme assayMore data for this Ligand-Target Pair
TargetPurine nucleoside phosphorylase(malaria parasite P. falciparum)
Industrial Research
Curated by ChEMBL
Industrial Research
Curated by ChEMBL

Affinity DataKd: 430nMT: 2°CAssay Description:The inhibitor dissociation constants reported in Table 1 below are for phosphorolysis of inosine by PNP and were based on reaction rates measurements...More data for this Ligand-Target Pair
TargetPurine nucleoside phosphorylase(malaria parasite P. falciparum)
Industrial Research
Curated by ChEMBL
Industrial Research
Curated by ChEMBL

Affinity DataKi: 500nMAssay Description:Binding affinity to Plasmodium falciparum 3D7 PNP assessed as inhibition constantMore data for this Ligand-Target Pair
TargetPurine nucleoside phosphorylase(malaria parasite P. falciparum)
Industrial Research
Curated by ChEMBL
Industrial Research
Curated by ChEMBL

Affinity DataKd: 550nMT: 2°CAssay Description:The inhibitor dissociation constants reported in Table 1 below are for phosphorolysis of inosine by PNP and were based on reaction rates measurements...More data for this Ligand-Target Pair
TargetPurine nucleoside phosphorylase(malaria parasite P. falciparum)
Industrial Research
Curated by ChEMBL
Industrial Research
Curated by ChEMBL
Affinity DataKi: 580nM ΔG°: -35.2kJ/molepH: 7.7 T: 2°CAssay Description:PNP activity was monitored by absorbance change in a coupled assay. In the assay, inosine was converted to hypoxanthine, and then hypoxanthine was co...More data for this Ligand-Target Pair
TargetPurine nucleoside phosphorylase(malaria parasite P. falciparum)
Industrial Research
Curated by ChEMBL
Industrial Research
Curated by ChEMBL

Affinity DataKd: 770nMT: 2°CAssay Description:The inhibitor dissociation constants reported in Table 1 below are for phosphorolysis of inosine by PNP and were based on reaction rates measurements...More data for this Ligand-Target Pair
TargetPurine nucleoside phosphorylase(malaria parasite P. falciparum)
Industrial Research
Curated by ChEMBL
Industrial Research
Curated by ChEMBL
Affinity DataKi: 860nMAssay Description:Binding affinity to Plasmodium falciparum 3D7 PNP assessed as inhibition constantMore data for this Ligand-Target Pair
TargetPurine nucleoside phosphorylase(malaria parasite P. falciparum)
Industrial Research
Curated by ChEMBL
Industrial Research
Curated by ChEMBL
Affinity DataKi: 890nMAssay Description:Binding affinity to Plasmodium falciparum 3D7 PNP assessed as inhibition constantMore data for this Ligand-Target Pair
TargetPurine nucleoside phosphorylase(malaria parasite P. falciparum)
Industrial Research
Curated by ChEMBL
Industrial Research
Curated by ChEMBL
Affinity DataKi: 900nMAssay Description:Binding affinity to Plasmodium falciparum 3D7 PNP assessed as inhibition constantMore data for this Ligand-Target Pair
TargetPurine nucleoside phosphorylase(malaria parasite P. falciparum)
Industrial Research
Curated by ChEMBL
Industrial Research
Curated by ChEMBL

Affinity DataKd: 1.00E+3nMT: 2°CAssay Description:The inhibitor dissociation constants reported in Table 1 below are for phosphorolysis of inosine by PNP and were based on reaction rates measurements...More data for this Ligand-Target Pair
TargetPurine nucleoside phosphorylase(malaria parasite P. falciparum)
Industrial Research
Curated by ChEMBL
Industrial Research
Curated by ChEMBL
Affinity DataKd: 1.10E+3nMT: 2°CAssay Description:The inhibitor dissociation constants reported in Table 1 below are for phosphorolysis of inosine by PNP and were based on reaction rates measurements...More data for this Ligand-Target Pair
TargetPurine nucleoside phosphorylase(malaria parasite P. falciparum)
Industrial Research
Curated by ChEMBL
Industrial Research
Curated by ChEMBL
Affinity DataKi: 1.29E+3nM ΔG°: -33.3kJ/molepH: 7.7 T: 2°CAssay Description:PNP activity was monitored by absorbance change in a coupled assay. In the assay, inosine was converted to hypoxanthine, and then hypoxanthine was co...More data for this Ligand-Target Pair
TargetPurine nucleoside phosphorylase(malaria parasite P. falciparum)
Industrial Research
Curated by ChEMBL
Industrial Research
Curated by ChEMBL
Affinity DataKd: 1.38E+3nMT: 2°CAssay Description:The inhibitor dissociation constants reported in Table 1 below are for phosphorolysis of inosine by PNP and were based on reaction rates measurements...More data for this Ligand-Target Pair