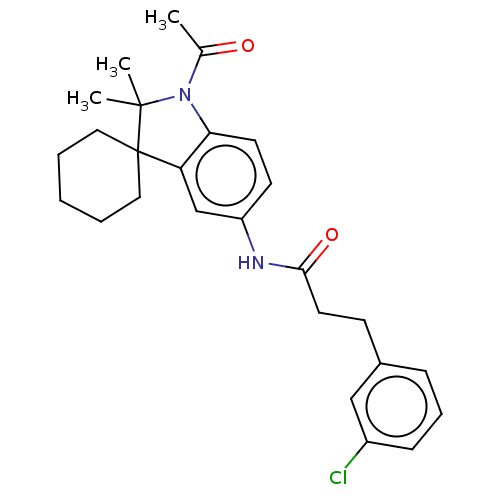
Affinity DataIC50: 8nMAssay Description:Antagonist activity at TSHR in rat FRTL-5 cells assessed as reduction in cAMP production incubated for 2 hrs by Eu-cAMP tracer based TR-FRET assayMore data for this Ligand-Target Pair
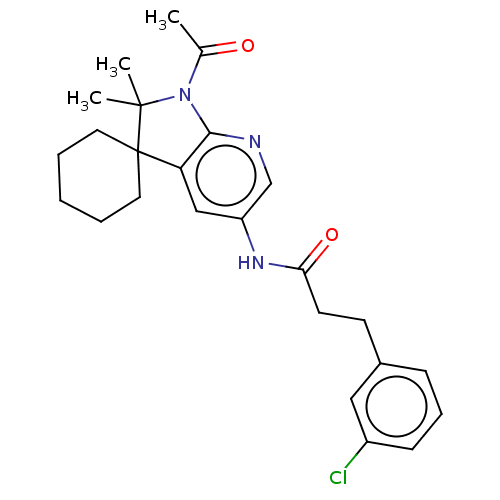
Affinity DataIC50: 10nMAssay Description:Antagonist activity at TSHR in rat FRTL-5 cells assessed as reduction in cAMP production incubated for 2 hrs by Eu-cAMP tracer based TR-FRET assayMore data for this Ligand-Target Pair

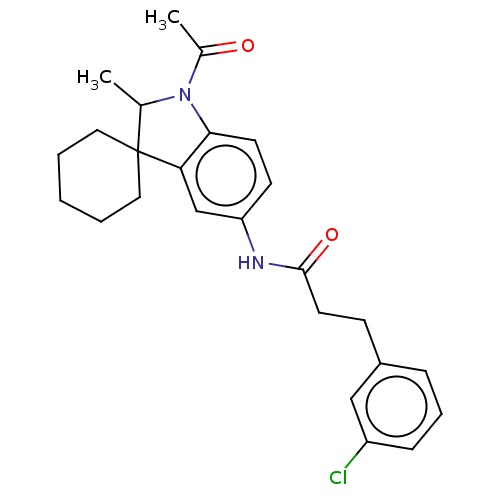
Affinity DataIC50: 16nMAssay Description:Antagonist activity at TSHR in rat FRTL-5 cells assessed as reduction in cAMP production incubated for 2 hrs by Eu-cAMP tracer based TR-FRET assayMore data for this Ligand-Target Pair
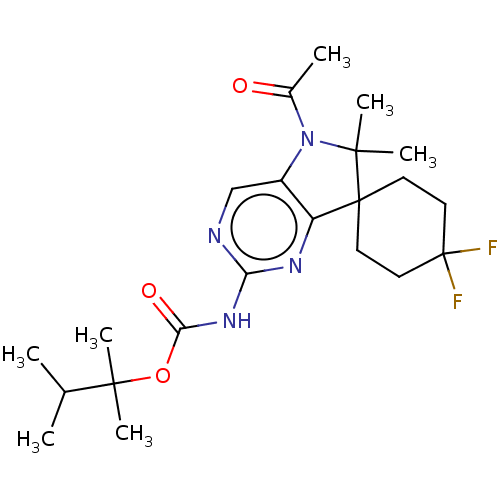
Affinity DataIC50: 18nMAssay Description:Antagonist activity at TSHR in rat FRTL-5 cells assessed as reduction in cAMP production incubated for 2 hrs by Eu-cAMP tracer based TR-FRET assayMore data for this Ligand-Target Pair
Affinity DataIC50: 21nMAssay Description:Antagonist activity at TSHR in rat FRTL-5 cells assessed as reduction in cAMP production incubated for 2 hrs by Eu-cAMP tracer based TR-FRET assayMore data for this Ligand-Target Pair
Affinity DataIC50: 21nMAssay Description:Antagonist activity at TSHR in rat FRTL-5 cells assessed as reduction in cAMP production incubated for 2 hrs by Eu-cAMP tracer based TR-FRET assayMore data for this Ligand-Target Pair

Affinity DataIC50: 22nMAssay Description:Antagonist activity at TSHR in rat FRTL-5 cells assessed as inhibition of M22-induced cAMP production incubated for 2 hrs by Eu-cAMP tracer based TR-...More data for this Ligand-Target Pair
Affinity DataIC50: 27nMAssay Description:Antagonist activity at TSHR in rat FRTL-5 cells assessed as reduction in cAMP production incubated for 2 hrs by Eu-cAMP tracer based TR-FRET assayMore data for this Ligand-Target Pair
Affinity DataIC50: 30nMAssay Description:Antagonist activity at TSHR in rat FRTL-5 cells assessed as reduction in cAMP production incubated for 2 hrs by Eu-cAMP tracer based TR-FRET assayMore data for this Ligand-Target Pair
Affinity DataIC50: 38nMAssay Description:Antagonist activity at TSHR in rat FRTL-5 cells assessed as reduction in cAMP production incubated for 2 hrs by Eu-cAMP tracer based TR-FRET assayMore data for this Ligand-Target Pair
Affinity DataIC50: 39nMAssay Description:Antagonist activity at TSHR in rat FRTL-5 cells assessed as reduction in cAMP production incubated for 2 hrs by Eu-cAMP tracer based TR-FRET assayMore data for this Ligand-Target Pair
Affinity DataIC50: 48nMAssay Description:Antagonist activity at TSHR in rat FRTL-5 cells assessed as reduction in cAMP production incubated for 2 hrs by Eu-cAMP tracer based TR-FRET assayMore data for this Ligand-Target Pair
Affinity DataIC50: 48nMAssay Description:Antagonist activity at TSHR in rat FRTL-5 cells assessed as reduction in cAMP production incubated for 2 hrs by Eu-cAMP tracer based TR-FRET assayMore data for this Ligand-Target Pair
Affinity DataIC50: 48nMAssay Description:Antagonist activity at TSHR in rat FRTL-5 cells assessed as reduction in cAMP production incubated for 2 hrs by Eu-cAMP tracer based TR-FRET assayMore data for this Ligand-Target Pair
Affinity DataIC50: 68nMAssay Description:Antagonist activity at TSHR in rat FRTL-5 cells assessed as reduction in cAMP production incubated for 2 hrs by Eu-cAMP tracer based TR-FRET assayMore data for this Ligand-Target Pair
Affinity DataIC50: 76nMAssay Description:Antagonist activity at TSHR in rat FRTL-5 cells assessed as reduction in cAMP production incubated for 2 hrs by Eu-cAMP tracer based TR-FRET assayMore data for this Ligand-Target Pair
Affinity DataIC50: 83nMAssay Description:Antagonist activity at TSHR in rat FRTL-5 cells assessed as reduction in cAMP production incubated for 2 hrs by Eu-cAMP tracer based TR-FRET assayMore data for this Ligand-Target Pair

Affinity DataIC50: 84nMAssay Description:Antagonist activity at TSHR in rat FRTL-5 cells assessed as reduction in cAMP production incubated for 2 hrs by Eu-cAMP tracer based TR-FRET assayMore data for this Ligand-Target Pair
Affinity DataIC50: 89nMAssay Description:Antagonist activity at TSHR in rat FRTL-5 cells assessed as reduction in cAMP production incubated for 2 hrs by Eu-cAMP tracer based TR-FRET assayMore data for this Ligand-Target Pair
Affinity DataIC50: 97nMAssay Description:Antagonist activity at TSHR in rat FRTL-5 cells assessed as reduction in cAMP production incubated for 2 hrs by Eu-cAMP tracer based TR-FRET assayMore data for this Ligand-Target Pair
Affinity DataIC50: 114nMAssay Description:Antagonist activity at TSHR in rat FRTL-5 cells assessed as reduction in cAMP production incubated for 2 hrs by Eu-cAMP tracer based TR-FRET assayMore data for this Ligand-Target Pair
Affinity DataIC50: 142nMAssay Description:Antagonist activity at TSHR in rat FRTL-5 cells assessed as reduction in cAMP production incubated for 2 hrs by Eu-cAMP tracer based TR-FRET assayMore data for this Ligand-Target Pair

Affinity DataIC50: 187nMAssay Description:Antagonist activity at TSHR in rat FRTL-5 cells assessed as reduction in cAMP production incubated for 2 hrs by Eu-cAMP tracer based TR-FRET assayMore data for this Ligand-Target Pair
Affinity DataIC50: 234nMAssay Description:Antagonist activity at TSHR in rat FRTL-5 cells assessed as reduction in cAMP production incubated for 2 hrs by Eu-cAMP tracer based TR-FRET assayMore data for this Ligand-Target Pair
Affinity DataIC50: 2.00E+3nMAssay Description:Inhibition of Saccharomyces cerevisiae H+ ATPase pma1 isoform assessed as ATP hydrolysis incubated for 30 mins by colorimetric methodMore data for this Ligand-Target Pair
Affinity DataIC50: 4.50E+3nMAssay Description:Allosteric inhibition of H+ ATPase pma1 isoform by measuring NADP-coupled ATPase activity in presence of 1 mM ATP by spectrophotometry methodMore data for this Ligand-Target Pair
Affinity DataIC50: 5.50E+3nMAssay Description:Inhibition of Saccharomyces cerevisiae H+ ATPase pma1 isoform assessed as ATP hydrolysis incubated for 30 mins by colorimetric methodMore data for this Ligand-Target Pair
Affinity DataIC50: 6.30E+3nMAssay Description:Allosteric inhibition of H+ ATPase pma1 isoform by measuring NADP-coupled ATPase activity in presence of 10 mM ATP by spectrophotometry methodMore data for this Ligand-Target Pair
Affinity DataIC50: 6.90E+3nMAssay Description:Inhibition of Saccharomyces cerevisiae H+ ATPase pma1 isoform assessed as ATP hydrolysis incubated for 30 mins by colorimetric methodMore data for this Ligand-Target Pair
Affinity DataIC50: 7.40E+3nMAssay Description:Inhibition of Saccharomyces cerevisiae H+ ATPase pma1 isoform assessed as ATP hydrolysis incubated for 30 mins by colorimetric methodMore data for this Ligand-Target Pair
Affinity DataIC50: 9.70E+3nMAssay Description:Inhibition of Saccharomyces cerevisiae H+ ATPase pma1 isoform assessed as ATP hydrolysis incubated for 30 mins by colorimetric methodMore data for this Ligand-Target Pair
Affinity DataIC50: 1.00E+4nMAssay Description:Antagonist activity at TSHR in rat FRTL-5 cells assessed as reduction in cAMP production incubated for 2 hrs by Eu-cAMP tracer based TR-FRET assayMore data for this Ligand-Target Pair
Affinity DataIC50: 1.11E+4nMAssay Description:Inhibition of Saccharomyces cerevisiae H+ ATPase pma1 isoform assessed as ATP hydrolysis incubated for 30 mins by colorimetric methodMore data for this Ligand-Target Pair
Affinity DataIC50: 1.68E+4nMAssay Description:Allosteric inhibition of H+ ATPase pma1 isoform by measuring NADP-coupled ATPase activity in presence of 10 mM ATP by spectrophotometry methodMore data for this Ligand-Target Pair
Affinity DataIC50: 1.73E+4nMAssay Description:Inhibition of Saccharomyces cerevisiae H+ ATPase pma1 isoform assessed as ATP hydrolysis incubated for 30 mins by colorimetric methodMore data for this Ligand-Target Pair
Affinity DataIC50: 1.87E+4nMAssay Description:Inhibition of Saccharomyces cerevisiae H+ ATPase pma1 isoform assessed as ATP hydrolysis incubated for 30 mins by colorimetric methodMore data for this Ligand-Target Pair
Affinity DataIC50: 1.88E+4nMAssay Description:Inhibition of Saccharomyces cerevisiae H+ ATPase pma1 isoform assessed as ATP hydrolysis incubated for 30 mins by colorimetric methodMore data for this Ligand-Target Pair
Affinity DataIC50: 2.00E+4nMAssay Description:Inhibition of Saccharomyces cerevisiae H+ ATPase pma1 isoform assessed as ATP hydrolysis incubated for 30 mins by colorimetric methodMore data for this Ligand-Target Pair
Affinity DataIC50: 2.30E+4nMAssay Description:Inhibition of Saccharomyces cerevisiae H+ ATPase pma1 isoform assessed as ATP hydrolysis incubated for 30 mins by colorimetric methodMore data for this Ligand-Target Pair
Affinity DataIC50: 2.49E+4nMAssay Description:Inhibition of Saccharomyces cerevisiae H+ ATPase pma1 isoform assessed as ATP hydrolysis incubated for 30 mins by colorimetric methodMore data for this Ligand-Target Pair
Affinity DataIC50: 2.97E+4nMAssay Description:Allosteric inhibition of H+ ATPase pma1 isoform by measuring NADP-coupled ATPase activity in presence of 1 mM ATP by spectrophotometry methodMore data for this Ligand-Target Pair
Affinity DataIC50: 3.62E+4nMAssay Description:Inhibition of Saccharomyces cerevisiae H+ ATPase pma1 isoform assessed as ATP hydrolysis incubated for 30 mins by colorimetric methodMore data for this Ligand-Target Pair
Affinity DataIC50: 5.18E+4nMAssay Description:Inhibition of Saccharomyces cerevisiae H+ ATPase pma1 isoform assessed as ATP hydrolysis incubated for 30 mins by colorimetric methodMore data for this Ligand-Target Pair
Affinity DataIC50: 5.27E+4nMAssay Description:Inhibition of Saccharomyces cerevisiae H+ ATPase pma1 isoform assessed as ATP hydrolysis incubated for 30 mins by colorimetric methodMore data for this Ligand-Target Pair
Affinity DataIC50: 6.00E+4nMAssay Description:Allosteric inhibition of H+ ATPase pma1 isoform by measuring NADP-coupled ATPase activity in presence of 10 mM ATP by spectrophotometry methodMore data for this Ligand-Target Pair
Affinity DataIC50: 7.80E+4nMAssay Description:Allosteric inhibition of H+ ATPase pma1 isoform by measuring NADP-coupled ATPase activity in presence of 1 mM ATP by spectrophotometry methodMore data for this Ligand-Target Pair
Affinity DataIC50: 1.07E+5nMAssay Description:Inhibition of Saccharomyces cerevisiae H+ ATPase pma1 isoform assessed as ATP hydrolysis incubated for 30 mins by colorimetric methodMore data for this Ligand-Target Pair
Affinity DataIC50: 1.67E+5nMAssay Description:Inhibition of Saccharomyces cerevisiae H+ ATPase pma1 isoform assessed as ATP hydrolysis incubated for 30 mins by colorimetric methodMore data for this Ligand-Target Pair
Affinity DataIC50: 1.67E+5nMAssay Description:Inhibition of Saccharomyces cerevisiae H+ ATPase pma1 isoform assessed as ATP hydrolysis incubated for 30 mins by colorimetric methodMore data for this Ligand-Target Pair
Affinity DataIC50: 1.67E+5nMAssay Description:Inhibition of Saccharomyces cerevisiae H+ ATPase pma1 isoform assessed as ATP hydrolysis incubated for 30 mins by colorimetric methodMore data for this Ligand-Target Pair